GLOBAL ECONOMICS
GLOBAL ECONOMICS COMMENTARIES
How are the Children of Visible Minority Immigrants Doing? An Update Based on the National Household Survey: An Abstract
Complete study is now available in

May 11, 2016
This paper examines the performance of the children of immigrants (called 2nd generation immigrants) to Canada using data from the 2011 National Household Survey, which was administered along with the 2011 Census. While concerns have been expressed about the reliability of this survey given its voluntary nature, it is the most recent data available and is of suitable quality for the purpose at hand.
As the composition of immigration inflows has shifted after 1980 from the traditional European source countries to the Third World, the analysis in the paper focuses on the labour market performance of 2nd generation immigrants who belong to visible minorities. This is to determine if the poor labour market performance of first generation visible minority immigrants is having any adverse effects on the educational and labour market outcomes of their children.
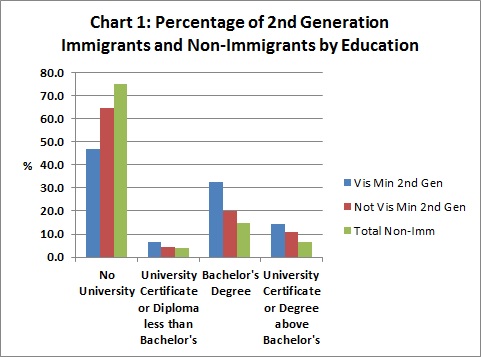
An encouraging fact revealed by the data is that 2nd generation visible minority immigrants are becoming more highly educated than both 2nd generation non-visible minority immigrants and non-immigrants –53.4 per cent of 2nd generation visible minority between 25 and 44 with employment income had earned university certificates or degrees compared to only 35.4 per cent of non-visible minority 2nd generation immigrants and 25.2 per cent of non-immigrants in the same age groups (Chart 1).
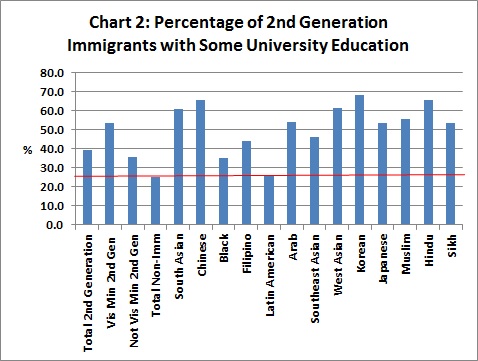
However, the educational attainment among groups varied from the high levels achieved by Asians to the low levels of Latin Americans and Blacks (Chart 2).
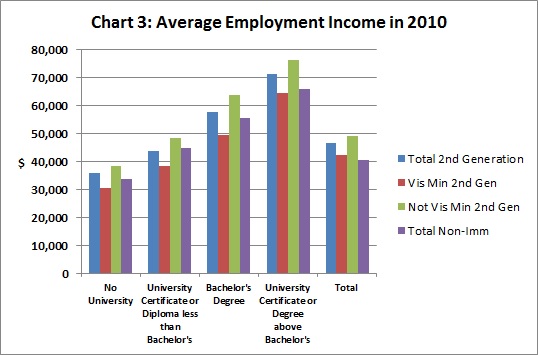
But, while 2nd generation visible minority immigrants obtained more education than 2nd generation non-visible minority immigrants and non-immigrants, their performance as a group did not measure up so well in the labour market (Chart 3). In the 25 to 44 age group 2nd generation visible minority immigrants earned on average $42,206, which was higher than the $40,431 earned by non-immigrants, but less the $49,202 earned by 2nd generation non-visible minority immigrants.
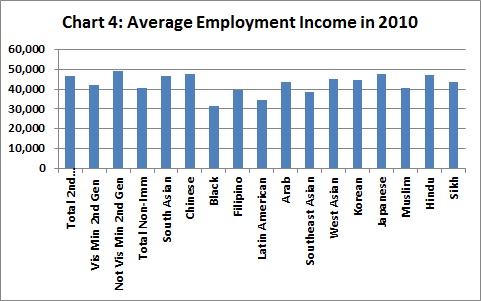
The labour market performance varies significantly among different visible minority groups (Chart 4). 2nd generation Chinese immigrants in the 25 to 44 age group actually earned $47,879 and South Asians $46,662. Because of the large number of Chinese and South Asians included as 2nd generation immigrants, this buoyed up the overall average and masked the unfortunate fact that many other visible minority groups are actually doing much worse than average overall and falling short of non-immigrants.
Another troubling fact is that, for any given level of education, 2nd generation Black and Latin American immigrants earn substantially less than non-immigrants and especially non-visible minority immigrants.
The paper provides encouraging evidence that the children of the visible minority, immigrants who are now performing so poorly in Canada’s labour market will do much better than their parents and catch up or surpass the earnings of non-immigrant groups, but will have a hard time keeping up with their non-visible minority counterparts. The results, while broadly in line with its predecessor (Grady, 2011), are more encouraging concerning the performance of 2nd generation visible minority immigrants.